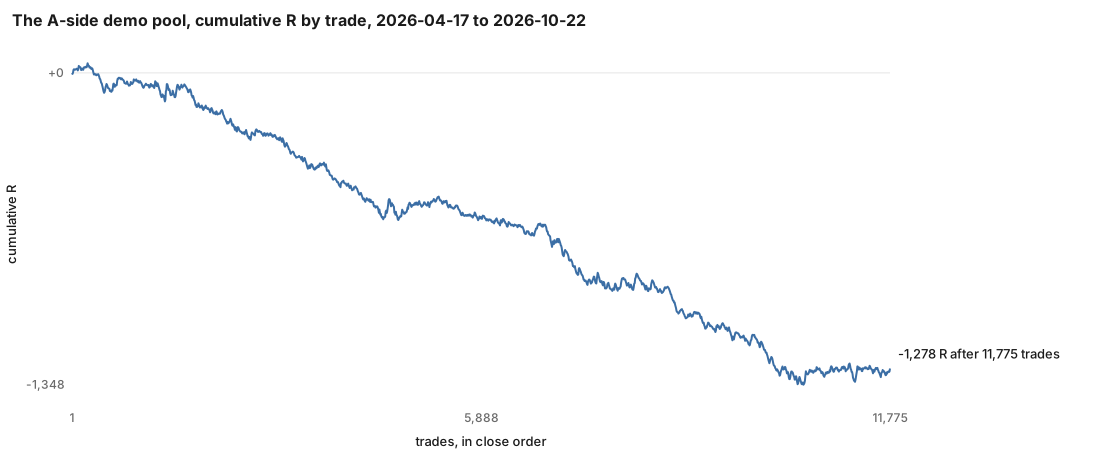
The weekly sweep in the first post handed its survivors to a fleet of demo accounts. Four of those accounts took every signal their rules produced, with no cap on open positions, so their record is the complete stream of what the rules did, not a selection from it. This post is that record, and the arithmetic that sits under it.
What was tested
- Rules from the weekly sweep, deployed to four demo accounts on the same MT5 broker feed, 17 April to 22 October 2026. Every rule a single condition on five-minute bars, a 2 to 3.5 ATR stop, a 2 to 4.5 R target, flat at day end. The books were refreshed weekly: rules that decayed were dropped, new survivors admitted.
- Every trade is measured in R, the risk on that trade, so that a trade on US100 and a trade on EURGBP count the same.
- The figures come from a replay of each trade on its real one-minute path, which reproduces 99 percent of the real exits; the earlier diagnosis of 25 September 2026, on the reconstruction of that day, is quoted beside them.
What came out
| Trades | Total R | R per trade | 95 percent interval | |
|---|---|---|---|---|
| Four demo accounts, every signal taken | 11,775 | -1,278.5 | -0.109 | -0.141 to -0.076 |
| First half of the record | -0.106 | |||
| Second half of the record | -0.111 | |||
| Every demo account in the fleet | 17,359 | -0.115 |
Win rate 28.8 percent. The 25 September diagnosis, on 9,733 trades, read -0.140 R per trade with an interval from -0.176 to -0.101, and put the spread at about 0.08 R of it, so the result before costs was about -0.045 R per trade with an interval that just reached zero. In plain words: at the most, break-even before the spread, and the same in both halves. Not one account was net positive.
These were rules that had each passed a year out of sample. The earlier post showed how many of them there are every week. This is what they are worth when traded.
The noise floor
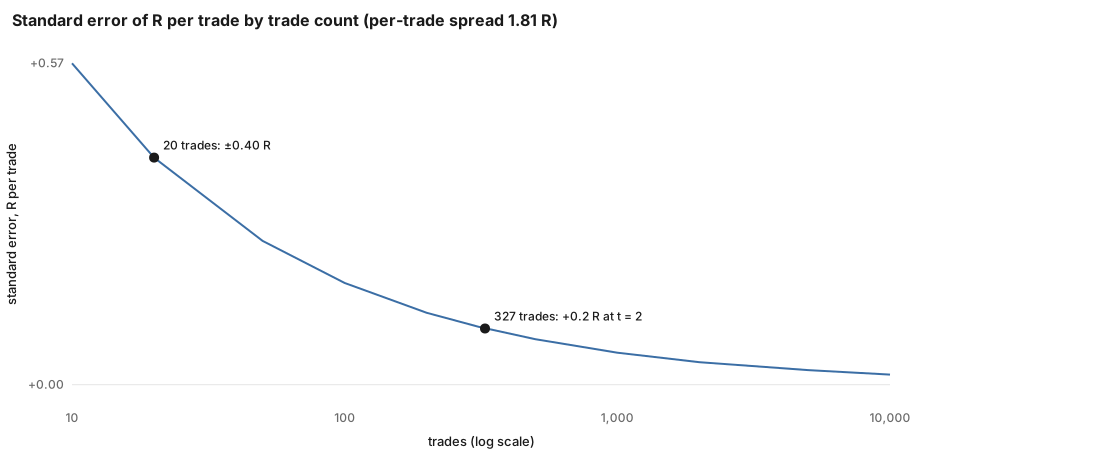
The per-trade R of this pool has a standard deviation of 1.81 R. That one number sets how many trades it takes before any mean R per trade can be told from zero: the standard error is 1.81 divided by the square root of the trade count, and an edge needs to be about twice that to clear chance.
| Trades | Standard error, R per trade | Smallest edge detectable at t = 2 |
|---|---|---|
| 10 | 0.57 | 1.14 R |
| 20 | 0.40 | 0.81 R |
| 50 | 0.26 | 0.51 R |
| 100 | 0.18 | 0.36 R |
| 200 | 0.13 | 0.26 R |
| 330 | 0.10 | 0.20 R |
| 1,000 | 0.06 | 0.11 R |
| 5,000 | 0.03 | 0.05 R |
A +0.2 R per trade edge, which would be a very good day-trading rule after costs, needs about 330 trades to reach t = 2. A 20-trade result has a standard error of 0.4 R per trade: a rule with no edge at all lands anywhere between -0.8 and +0.8 R per trade on 20 trades most of the time. Most rule results posted anywhere are 20 to 50 trades.
What it means
- A rule that passes a year out of sample is a candidate, not an edge. The fleet traded thousands of such candidates and the pool lost.
- Trade counts first, always. Below about a hundred trades a verdict is not available, whatever the total R says; between a hundred and the number in the table, "net positive" is the most that can be claimed.
- The loss is not the spread alone. Before costs the pool was about break-even, which means the entries carried no information. The next posts take that apart: how much of the survivor count chance alone produces, whether a rule's backtest R predicts its live R, where the price went after each signal at every horizon up to a week, and what the backtester's fill model had to do with the gap between its number and this one.
Not tested here: any rule with more than one condition, any clock slower than five minutes, holding overnight, any account other than demo. The honesty panel on this site prints the standard error and the trades-needed line from this arithmetic on every result.
Research on demo accounts, in R, risk units. Past results do not predict future results. This is not advice.